
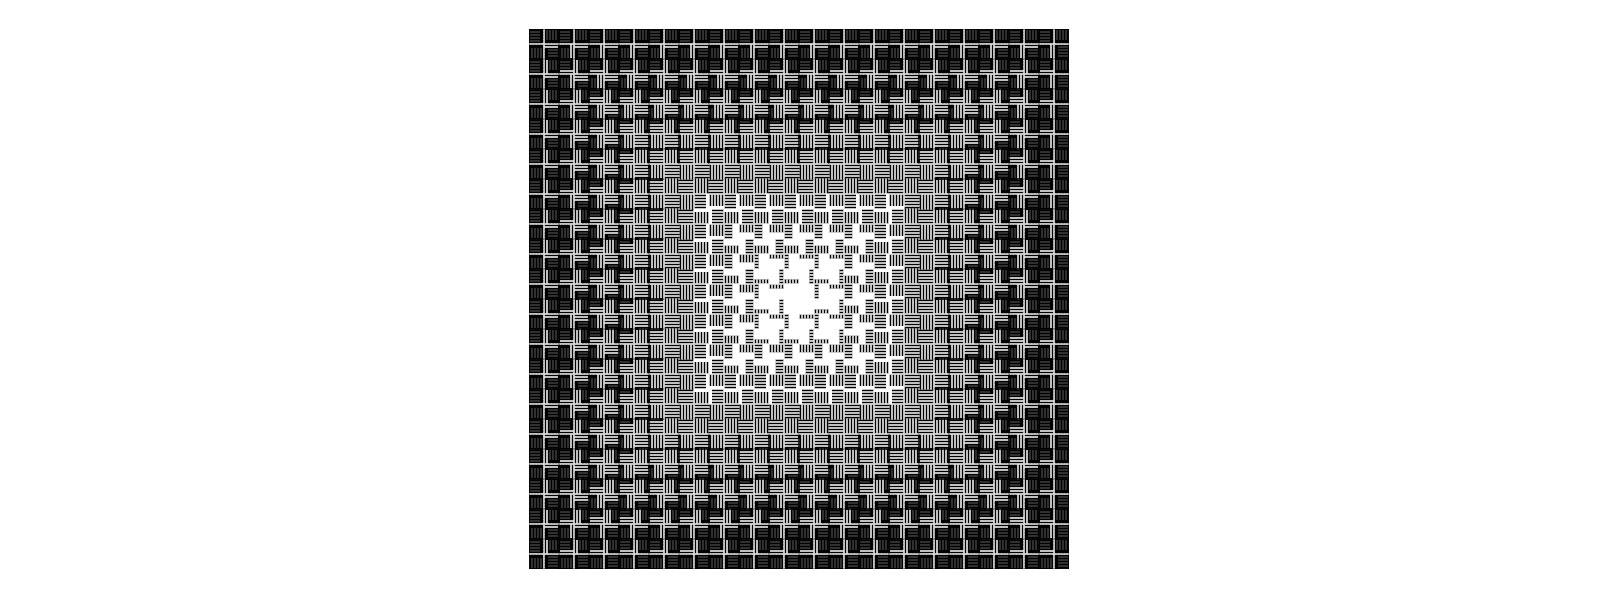
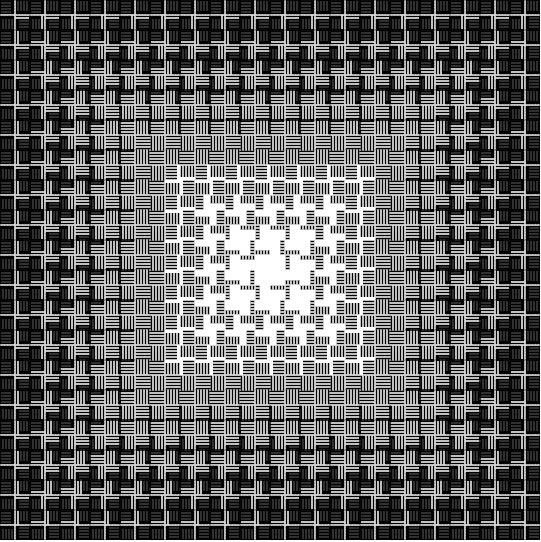
De Computer Graphics and Art vol2 n°3 page 28
// This sketch is part of the ReCode Project - http://recodeproject.com
// From Computer Graphics and Art vol2 no3 pg 28
// Segrid
// by John Roy
//
// Quin Kennedy
// 2012
// Creative Commons license CC BY-SA 3.0

//Since there are
//8 sets of images plus a center empty image plus a 1/2 width of black border
//this gives a canvas size of 8*2+1+.5*2 = 9*2 = 18 cells
//each cell is 20 pixels wide (see comment in drawTile(...))
var pixelSize = 1.5;
var linesPerQuadrant = 5;
//the tile size is the
//(lines per quadrant + spaces per quadrant) * 2 quadrants per side * pixelSize
var tileSize = linesPerQuadrant*2*2;
var visualTileSize = tileSize*pixelSize;
//subtract 1 because the center is not doubled
//subtract another 1 because we only see half of the last tiles
var numTiles = linesPerQuadrant*4-1-1;
var windowSize = numTiles*tileSize;
var visualWinSize = numTiles*visualTileSize;

function setup(){
 createCanvas(ceil(visualWinSize), ceil(visualWinSize));
 noLoop();
}

function draw(){
 background(255);
 stroke(0);
 fill(0);
 strokeWeight(1);
 strokeCap(SQUARE);
 push();
 scale(pixelSize);
 //translate(-tileSize/2., -tileSize/2.);
 //pick a random grid cell to be the focal point
 //for now we will restrict it to have at most one row/column of empty squares
 var focusX = numTiles/2;
 var focusY = numTiles/2;
 //for each grid cell...
 for(var i = 0, gi = 0; i <= numTiles; i++, gi += tileSize){
 for(var j = 0, gj = 0; j <= numTiles; j++, gj += tileSize){
 push();
 translate(gi,gj);
 var num = min(max(abs(focusX-i), abs(focusY-j)), linesPerQuadrant*2);
 drawTile(num);
 pop();
 }
 }
 pop();
}

function drawTile(iteration){
 //there are two versions of the tile, the first where 5 lines (with 5 spaces)
 //grow in,
 //and the second where each consecutive space gets filled in.
 if (iteration == 0){
 return;
 }
 push();
 for(var i = 0; i < 4; i++){
 push();
 translate(-linesPerQuadrant*2, -linesPerQuadrant*2);
 drawQuadrant(iteration);
 pop();
 rotate(HALF_PI);
 }
 pop();
}

function drawQuadrant(iteration){
 if (iteration < linesPerQuadrant){
 push();
 for(var i = 0; i < linesPerQuadrant; i++){
 line(0, .5, iteration*linesPerQuadrant*2.0/(linesPerQuadrant-1.0), 0.5);
 translate(0, 2);
 }
 pop();
 } else {
 drawQuadrant(linesPerQuadrant - 1);
 var lines = iteration - linesPerQuadrant;
 push();
 translate(0, linesPerQuadrant*2-1);
 for(var i = 0; i <= lines; i++){
 line(0, .5, linesPerQuadrant*2, .5);
 translate(0, -2);
 }
 pop();
 }
}